
Making Kolu's macOS e2e CI lane 14x faster
Kolu is a terminal-native cockpit for coding agents, and its e2e suite is the expensive kind of honest: 440 Cucumber scenarios driving real Chromium instances via Playwright against real Kolu servers, on every PR, on two platforms. The macOS lane runs on rasam, a 24-core, 128 GB Apple Silicon box we share with other CI. On June 9 I noticed that lane was taking the better part of an hour, and typed this:
What follows is what the investigation actually found, in the order it found it. Three independent causes were stacked on top of each other, and the most embarrassing one had been in master for three days, invisible because every run was green.
Same 440 scenarios at every point on that chart. No test was deleted, no timeout trimmed, no coverage moved.
First, decompose the lane time
Kolu’s CI runner, odu, posts a commit status per recipe@platform and keeps a per-recipe log. That gives you two free instruments: status timestamps for lane wall-clock across PRs, and the log to decompose a single lane. The decomposition of a typical 37-minute lane was lopsided:
| Phase | Time |
|---|---|
setup + pnpm install | ~30 s |
nix build .#koluBin (warm store) | ~1 min |
| Cucumber suite | 33m 10s |
The suite was the whole cost — but the same suite finished in ~8 minutes on the Linux lane. So nothing was wrong with the tests. Something was wrong with where they ran, and with how many of them ran at once. It turned out to be both, plus a third thing nobody suspected.
Cause 1: runaway macOS daemons on the CI host
First instinct on any slow shared box: profile the host, not the workload. ps aux | sort -k3 -rn | head on rasam, 83 days of uptime:
PID    %CPU  RSS      COMMAND
366    99.7  64.0 GB  fseventsd          ← root, pegged for weeks
18755  98.8   4.9 GB  mediaanalysisd-access   ← ~60 days of CPU burned
583     7.8   243 MB  mds_stores         ← Spotlight, bursts >100% during builds
43257 104.5   6.5 GB  ghc                ← co-tenant CI building Haskell
Three Apple daemons and one legitimate neighbor:
- fseventsd — the kernel’s file-system-events broker — was wedged at ~100% of a core with a 64 GB resident leak, even when the host was otherwise idle. This is doubly poisonous for e2e testing: FSEvents is exactly the channel Kolu’s file watchers (and the test suite’s live-reload scenarios) depend on, so a drowning fseventsd doesn’t just steal a core — it drops the events whose absence we’d been calling “darwin flakiness” and absorbing with retries.
- mediaanalysisd, Apple’s photo-analysis agent, had spent roughly 60 days of accumulated CPU analyzing the Photos library of a headless CI bot account.
- Spotlight was dutifully indexing every file that Nix builds wrote, all day.
- vira, a co-tenant CI service, runs multi-hour GHC builds that legitimately take ~16 cores. Intermittent, but real.
The lesson generalizes: long uptimes are a liability on macOS CI hosts. None of this shows up in your test profiler, because none of it is your code.
Cause 2: concurrent PR pipelines on one shared Mac
odu fans each PR’s pipeline out independently, and rasam is a single shared lane host. Pull the e2e status timestamps for one afternoon’s PRs and the problem draws itself:
Each suite spawns its workers’ Kolu servers and Chromium instances; three at once is dozens of processes contending for whatever cores fseventsd, Spotlight, and a GHC build had left over. Every overlapped lane took 41–60 minutes. The fix isn’t to make the suites politer — it’s to stop them overlapping at all.
Fix: a host-level mutex and a load-aware worker count
#1259 made two changes to the just test recipe, both in plain bash:
The mutex is twelve lines of mkdir-as-atomic-primitive — macOS ships no flock(1) — with a dead-pid steal for crashed runs and a hard 60-minute ceiling after which a run proceeds unlocked: degraded mode is exactly the old behavior, never a deadlock. The binary build stays outside the lock because the Nix store already dedups concurrent builds of the same derivation.
The worker count stopped pretending the host was ours: (cores − loadavg1) / 3, clamped to the old floor and cap, sampled after acquiring the lock — a run that queued for half an hour must size itself from the load that’s left, not the load the previous suite was generating.
Lanes dropped from 41–60 minutes to 9–13. Good. Not the headline.
Cause 3: a bash typo ran the whole suite on one worker
While validating #1259 I added a one-line log of the resolved worker count, on a whim. The next run printed this:
e2e: workers=cap (cores=24 load=2 cap=6)Not workers=6. The string cap. The clamp line read:
if (( par > cap )); then par=cap; fi     # ← assigns the literal string "cap"
                  #         par=$cap     # ← what it meant
Inside (( )), bash treats cap as a variable; in a plain assignment it’s just three letters. The bug had entered master three days earlier in #1223 , in the most innocent refactor imaginable — par=8 became par=cap when the cap went per-platform, and the $ stayed behind.
Downstream, the damage was perfectly silent. Cucumber’s config does:
const parallel = parseInt(process.env.CUCUMBER_PARALLEL || "1", 10);  // "cap" → NaN
...(parallel > 1 && { parallel }),                                    // NaN > 1 → option dropped
NaN > 1 is false, the parallel option vanishes, and 440 scenarios run on one worker — green, every time. On every host whose computed count exceeded its cap. Which was every CI host we have, on both platforms, since June 7.
How to detect a silently-serial test run
You don’t need a log line to catch this class of bug. Cucumber prints two durations at the end of a run, and their ratio is a worker count:
Every “slow but green” lane in the baseline had the left-hand signature sitting in its log. We just never looked, because green.
#1261 is the fix: one $, plus a guard that refuses any non-numeric worker count out loud — e2e: invalid worker count and a hard exit — so the next config value that degrades parallelism does it as a red build instead of a quiet one. The Linux lane went from 7m35s to 1m29s on the same commit.
Fixing the host: what sudo can and cannot do on macOS
With root, the runbook was three moves — and macOS pushed back on each:
| Move | Result | The wall it hit |
|---|---|---|
kill wedged fseventsd | launchd respawns it: 64 GB → 18 MB, 100% → 0% | none — just give a 64 GB teardown a few seconds before you conclude the kill “didn’t take” |
mdutil -a -i off (Spotlight off) | mds_stores settles to 0% | the separate /System/Volumes/Data mount reports unknown indexing state; disabling / and kicking the mds processes settles it |
| remove mediaanalysisd | contained, not removed | launchctl bootout is blocked by SIP even as root; moving its Photos-library trigger is blocked by TCC over ssh; the per-user launchctl disable only sticks at the next console login |
The containment for that last one is a five-line root LaunchDaemon — /Library/LaunchDaemons is not SIP-protected — that pkills the agent every five minutes until a human next logs into the console and the real disable takes effect. Crude, reversible, effective.
And one move we deliberately did not make: reboot. FileVault is on with no auto-login, so a remote reboot parks the machine at the pre-boot unlock screen — no ssh, no CI host, until someone with physical or Screen-Sharing access types a password. Check fdesetup status before you need to know this.
Results
| Stage | darwin e2e lane | what changed |
|---|---|---|
| baseline, Jun 9 | 41–60 min | serial suite (#1223 typo) × sick host × 3-suite pile-ups |
| #1259 | 9–13 min | suite mutex + load-aware workers (which, under load, also happened to restore parallelism) |
| host healed + #1261 | 3m28s | fseventsd/Spotlight/mediaanalysisd dealt with; the $ restored; fail-loud guard |
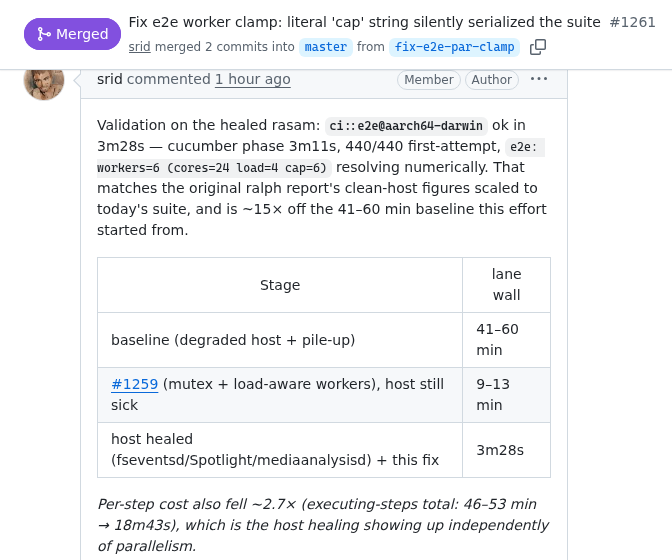
Two numbers tell the cleaner story. The suite’s total step time — the sum of every step’s duration, independent of worker count — fell from 46–53 minutes to 16–19 minutes: that’s the host healing, with parallelism factored out. And the wall-to-steps ratio went from 1.0 to ~5.9: that’s the typo dying.
The part I keep returning to: every one of those 41–60 minute lanes was green. Green is a statement about correctness, and we read it as a statement about health. The lane had been telling us exactly what was wrong the whole time — in a ratio of two durations nobody compared, on a host nobody profiled, behind a worker count nobody logged. The fix for that isn’t cleverness. It’s one echo:
e2e: workers=6 (cores=24 load=4 cap=6)